“Telemetry workobjects report” shows, based on the machines’ GPS data, how long and how many kilometres were spent on each workobject (for example a field) during work. With the report you can see how the working time and the distance travelled were divided between the objects.
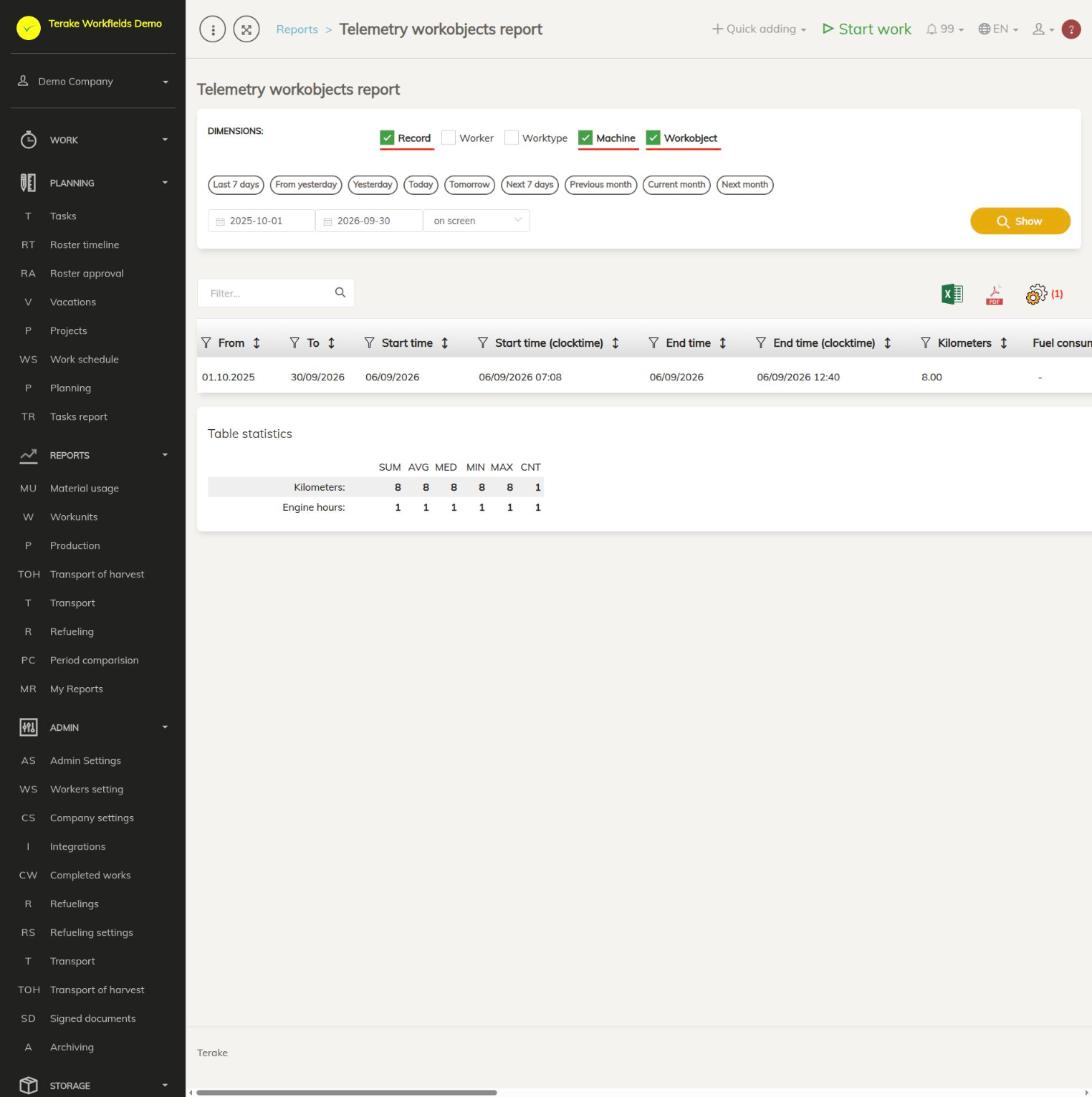
Page layout
- “Dimensions”: “Record” gives a separate row for each object of each work, with the start and end times. If “Record” is not selected, the data is added up by the selected dimensions: “Worker”, “Worktype”, “Machine” and “Workobject”. If “Record” is selected, the other dimensions are ignored.
- Period: the quick choices “Last 7 days”, “From yesterday”, “Yesterday”, “Today”, “Tomorrow”, “Next 7 days”, “Previous month”, “Current month” and “Next month”, or a start and end date. Works that start within the period are included.
- Output: “on screen” shows the result in a table, “MS Excel file” downloads it. The report is built with the “Show” button.
- Table: “From” and “To” (the selected period), “Start time”, “Start time (clocktime)”, “End time”, “End time (clock time)”, “Kilometers” (the distance travelled on the object), “Fuel consumption (l)”, “Engine hours” (the time spent on the object in hours), the names and IDs of the worker, work, machine and workobject, “Workobject group”, the field number (column “S”) and “Record count”. On summary rows, “Start time” is the date of the first work and “End time” the date of the last.
- Above the table: the “Filter…” search field, the icons “open in Excel” and “open as PDF file”, and “set view”, where you choose and order the columns shown.
- “Table statistics” below the table: the total (SUM), average (AVG), median (MED), minimum (MIN), maximum (MAX) and number of rows (CNT) of “Kilometers” and “Engine hours”.
How to build the report
- In the “Reports” menu, open the My reports page and choose “Telemetry workobjects report” there.
- Under “Dimensions”, tick “Record” to see each object of each work separately, or remove “Record” and select “Worker”, “Worktype”, “Machine” and/or “Workobject” to sum up the data. For example, you get a summary by field if you select only “Workobject”.
- Choose the period with a quick choice or enter the dates.
- Choose “on screen” or “MS Excel file” as the output and press “Show”.
- Narrow down the result with the filter icon in the column header or with the “Filter…” search field. Click a column’s title to sort by it.
Who can see it
The report is visible to the roles “Administrator”, “Observer”, “Agronomist”, “Dispatcher” and “Accountant”.
Tips
- The report includes only works that have a GPS track. Works without a GPS track do not appear in the report.
- The “Fuel consumption (l)” column is empty (a dash) in this report.
- A summary of a machine’s telemetry is on the Telemetry page.
API calls on this page
For integrations and AI assistants: this page uses the following Terake API calls. The full description is in the API reference.
When the page opens:
GET /api/report/telemetry-workobjects-report– Telemetry report per workobject, grouped by the requested dimensions.
Other calls from this screen’s dialogs and actions (from the web client’s code):
GET /api/materials/{id}– Get MaterialGET /api/materials/{id}/harvest_sources– Harvest Material sourcesGET /api/materials/{id}/material_composition– Harvest Material compositionGET /api/materials/{material_id}/inventory– MaterialInventory of a material