The “Workunits” report shows how many work units (for example piecework quantities, rooms cleaned or loads transported) have been entered on works in the selected period, together with the worker, work, workobject and machine. Managers and accountants use the report to calculate piecework and follow the workload.
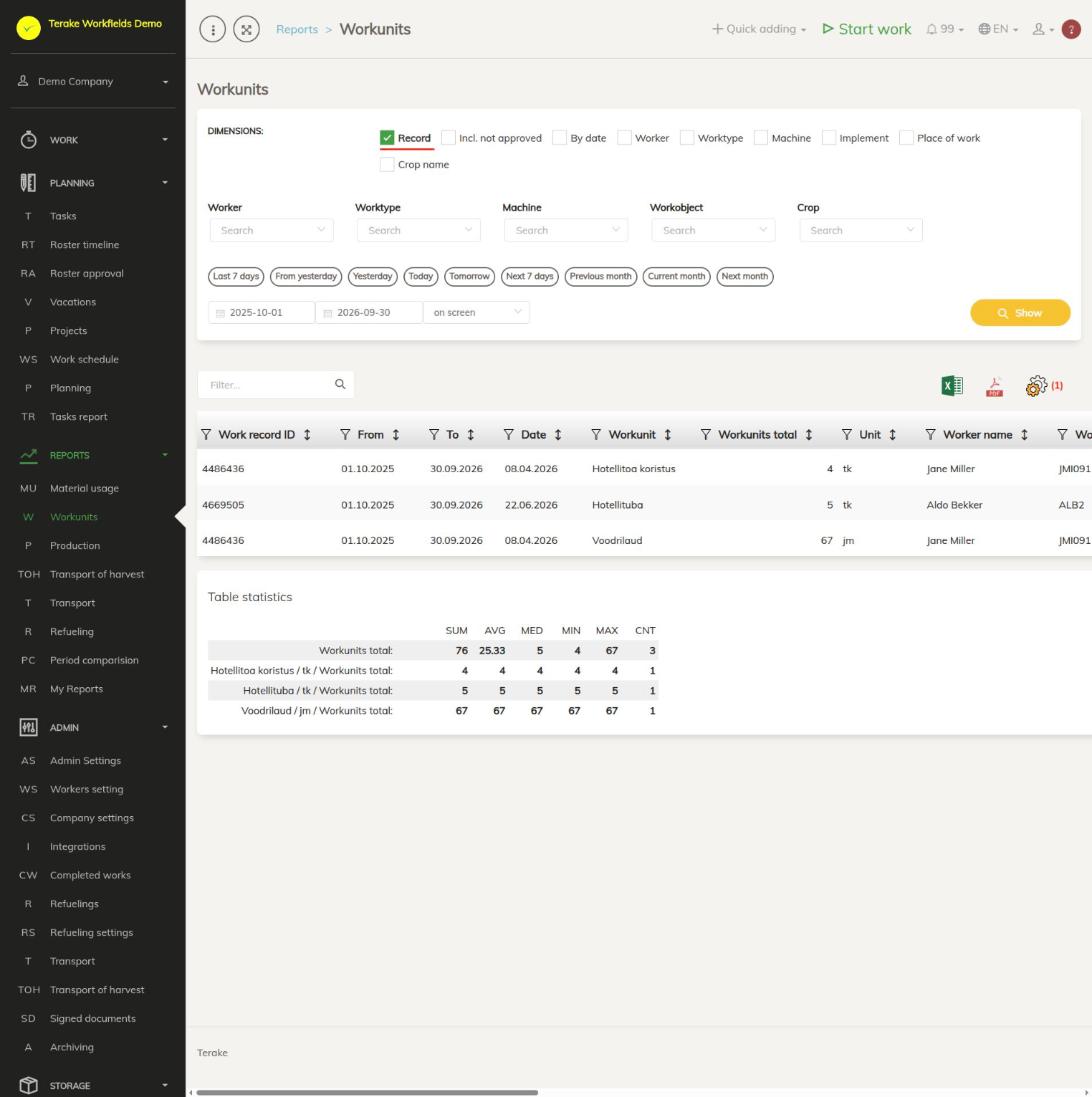
Page layout
- “Dimensions”: the options that the report rows are built by. “Record” gives a separate row for each work unit of each work. If “Record” is not selected, the amounts are added up by the selected dimensions: “By date”, “Worker”, “Worktype”, “Machine”, “Implement”, “Place of work”, and in an agricultural company also “Crop name”. Different work units are always on separate rows.
- “Incl. not approved”: without this option only approved works are counted.
- Filters: “Worker”, “Worktype”, “Machine” and “Workobject”, and in an agricultural company also “Crop name”. When you choose a value in a filter, the report holds only the works of that worker, work, machine or workobject.
- Period: the quick choices “Last 7 days”, “From yesterday”, “Yesterday”, “Today”, “Tomorrow”, “Next 7 days”, “Previous month”, “Current month” and “Next month”, or a start and end date. Works that start within the period are included.
- Output: “on screen” shows the result in a table, “MS Excel file” downloads it. The report is built with the “Show” button.
- Table: “Work record ID”, “From” and “To” (the selected period), “Date” (the start date of the work), “Workunit”, “Workunits total”, “Unit”, “Worker name”, “Worktype name”, “Workobject name”, “Main machine name”, “Implement name” and their ID2 columns. An agricultural company also has “Crop” and “Field number”. Columns that are not part of the selected dimensions stay empty on summary rows.
- Above the table: the “Filter…” search field, the icons “open in Excel” and “open as PDF file”, and “set view”, where you choose and order the columns shown.
- “Table statistics” below the table: the total (SUM), average (AVG), median (MED), minimum (MIN), maximum (MAX) and number of rows (CNT) of “Workunits total”, overall and for each work unit and unit.
How to build the report
- Tick the options you want under “Dimensions”. Select “Record” to see each work separately. For example, to get a summary of the workers’ piecework, remove “Record” and select “Worker”.
- Tick “Incl. not approved” if you also want to see works not yet approved.
- If needed, choose a worker, work, machine or workobject in the filters.
- Choose the period with a quick choice or enter the dates.
- Choose “on screen” or “MS Excel file” as the output and press “Show”.
- Narrow down the result with the filter icon in the column header or with the “Filter…” search field. Click a column’s title to sort by it.
The selected dimensions are remembered and are already selected next time.
Who can see it
In the “Reports” menu the report is visible to the roles “Administrator”, “Observer”, “Agronomist”, “Dispatcher” and “Accountant”. Crop details are visible only in an agricultural company’s account.
Tips
- The report includes only work units, not ordinary materials. Define work units on the Workunits page; the amount is added to a work on the “Workunits” tab of the work form.
- Material consumption is in the Material usage report, produced amounts in the Production report.
- If a summary shows an unexpectedly large amount, select “Record” and look at which works it is made up of.
API calls on this page
For integrations and AI assistants: this page uses the following Terake API calls. The full description is in the API reference.
When the page opens:
GET /api/report/workunit– Work units produced over a period – piecework counted alongside hours