“Graphical overview” shows the resources of one project on a timeline: how many hours of each worker, work, place of work, machine or maintenance unit have been forecast for the project, planned into tasks, put into the work schedule and actually worked. Project managers and planners use the page to follow a project’s workload and progress. The page opens from the Projects page with the chart icon on a row, or with the “Graphical overview” button in the project view.
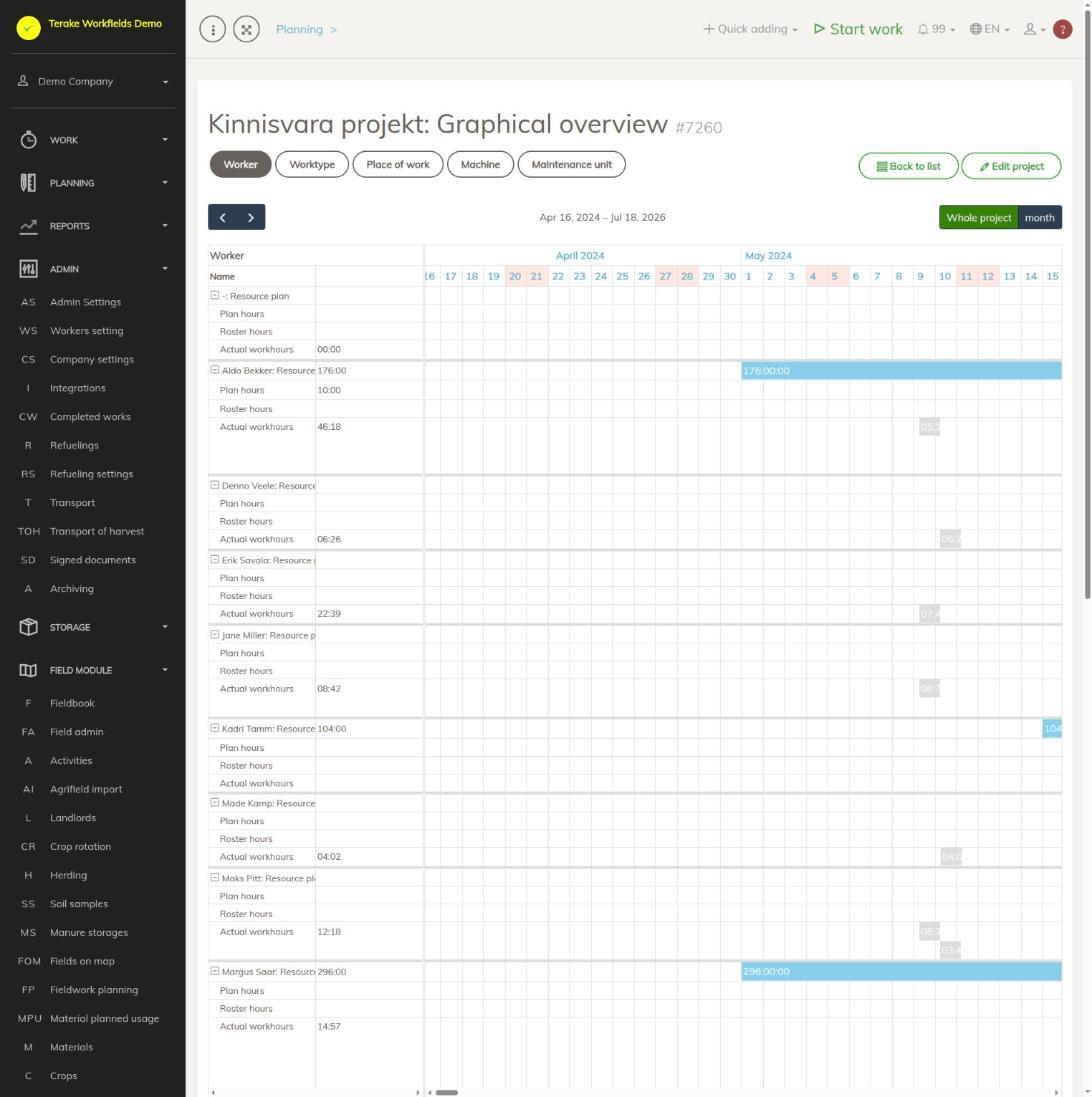
Page layout
- Heading: the project’s name and number.
- Resource buttons: “Worker”, “Worktype”, “Place of work”, “Machine”, “Maintenance unit”. Only the ones used in the project are shown. The selected button sets what the timeline rows are shown by.
- “Back to list” takes you to the project list, “Edit project” opens the project’s details.
- Timeline: use the arrows to move back and forth in time. On the right you can choose whether to show the whole project period or one month (“Month”). The whole-project view starts at the project’s earliest event and ends at its latest.
- “Total” block: the project’s “Progn. amount” (the project’s planned work hours), “Plan amount” (the hours of all the project’s tasks) and “Act.amount” (the hours of all the project’s completed works).
- “Resource usage” block: for each kind of resource, “Progn. amount”, “Plan hours”, “Roster hours” and “Actual workhours”.
- Buttons below the block: “Completed works” and “Tasks report” open this project’s work records and tasks, “Edit project” opens the project’s details.
- “To-do list” at the bottom of the page: the work the project still needs done.
Timeline rows
Each resource (for example a worker) has four rows:
- “… : Resource plan”: the forecast hours entered for this resource in the project view. The bar runs from the start to the end of the resource’s period (or the project’s, if the resource has none).
- “Plan hours”: the resource’s tasks in this project.
- “Roster hours”: the resource’s work schedules in this project.
- “Actual workhours”: the work records done for the project.
Next to each row is its total of hours. Each event’s bar shows its duration.
How to assess a project’s workload and progress
- Select a resource button, for example “Worker”.
- Compare the hours on each resource’s “Resource plan” row with the “Plan hours”, “Roster hours” and “Actual workhours” rows.
- Look at the “Total” and “Resource usage” blocks. The figures in brackets are the difference from the forecast in hours and per cent. Values above the forecast are red.
How to add or change a task
- To add a new task, click the timeline on that resource’s row on the day you want. The task form opens with the day (08:00–17:00) and the resource already filled in.
- To add a task based on a work in the “To-do list”, first press the button with the calendar icon on that row of the list. When you then click the timeline, the form is also filled with that work’s details (for example worktype, project, place of work, machine, customer).
- Fill in the form and press “Save and close”. The form’s fields are described on the Tasks page.
- To change an existing task or work schedule, click its bar; clicking the bar of a completed work opens the work record form.
Who can see and change it
The page can be opened by the roles “Administrator”, “Approver”, “Observer”, “Agronomist”, “Self planner”, “Power user” and “Project Manager”.
- Tasks can be changed by “Administrator”, “Agronomist”, “Self planner”, “Vehicle service”, “Power user” and “Project Manager”; a task linked to a worker also by “Approver”, “Foreman”, “Personnel” and the worker’s direct manager. The creator can change a task within 48 hours of creating it.
- Work records can be changed by “Administrator” and “Power user” (all of them), “Approver” (the work of the workers they approve), the worker’s direct manager and the project’s project manager (the work of their own project).
- “Observer” can only view tasks and work records.
Tips
- “Resource plan” rows appear only when a forecast amount has been entered for the resources in the project view. How to do this is described on the Projects page.
- A task, work schedule or work record appears in the overview only when this project is selected on it.
- Select several projects in the project list and press “View project graph” above the table to see the resources of several projects on one timeline.
API calls on this page
For integrations and AI assistants: this page uses the following Terake API calls. The full description is in the API reference.
When the page opens:
GET /api/gantt/{id}– Project tasks for Gantt graph by ID or UUIDGET /api/todos– Planitem collection
Adding, changing and deleting (from the API description):
DELETE /api/todos/{id}– Delete Planitem by ID or UUID
Other calls from this screen’s dialogs and actions (from the web client’s code):
DELETE /api/customer/{customer_id}/person/{id}– Deletes a Customer contact personDELETE /api/plans/{id}– Delete Planitem by ID or UUIDDELETE /api/plans/{planid}/materialusages/{usageid}– Deletes one material usage of a PlanitemDELETE /api/rosteritems/{id}– Delete Rosteritem by ID or UUIDGET /api/workers/brigade-members/{id}– Brigade members of one worker acting as foreman, by worker id.GET /api/planreport/{id}– Planitem by IDGET /api/planreportsync/{id}– Planitem by IDGET /api/plans/{id}– Planitem by IDGET /api/plans– Planitem collectionGET /api/plans/{id}/files– List all files related with parent objectGET /api/plans/{calendaritem_id}/recurrence– Recurrence Setup related to RosteritemGET /api/plans/{planid}/materialusages– Material usages planned on one planitem.GET /api/projects/{id}– Project by IDGET /api/relations/{object_type}/{object_id}– Returns the objects related to one Terake objectGET /api/workers/{id}/files– List all files related with parent objectGET /api/workobjectsonly/{id}– Get WorkobjectGET /api/worktypes/{id}– Get WorktypePOST /api/customer/{customer_id}/person/{id}– Creates or modifies a Customer contact personPOST /api/sendinvitationletter– Sends a partnership invitation to a customer's e-mail addressPOST /api/main_facility– Create FacilityPOST /api/maintenance_unit– Create FacilityPOST /api/plans/{planid}/materialusages– Adds material usage to a PlanitemPOST /api/plans/{id}/files– Add new file to parent objectPOST /api/plans/{planid}/mark-as-done– Creates a Workdone from a Planitem and marks the plan item donePOST /api/plans– Creates or modifies a PlanitemPOST /api/plans/{id}– Creates or modifies a PlanitemPOST /api/plans/{calendaritem_id}/recurrence– Creates or modifies the recurrence of a Rosteritem or PlanitemPOST /api/rosteritems/{id}– Creates or modifies a Rosteritem (Scheduled Work or an absence). Returns an array of itemsPUT /api/plans/{id}– Creates or modifies a Planitem. Planitem subtypes, set through roster_type, are Task (id 8,
the common case, with planned start and stop time), Todo (id 12, no planned stop time),
Teamwork (id 18) and Groupwork (id 19).