Statistics shows how much you worked in the selected period: hours day by day and broken down by work, machine and more. The page shows only your own works.
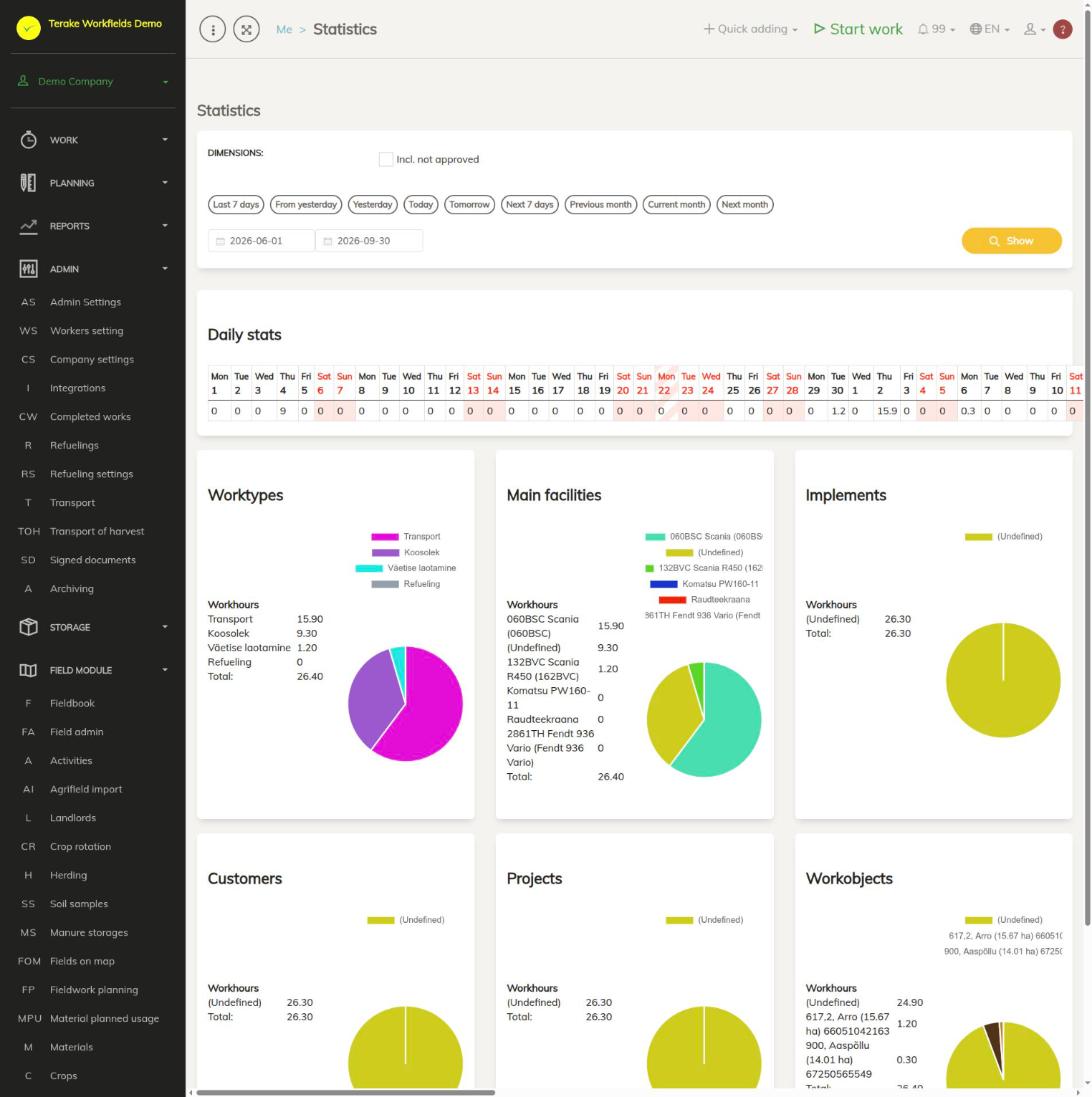
Page layout
- Period selection: quick buttons (for example “Current month”), the start and end date, the “Incl. not approved” checkbox and the “Show” button.
- “Daily stats”: the hours of each day. Weekends and public holidays are marked in a different colour.
- Charts: hours divided by “Worktypes”, “Main facilities”, “Implements”, “Customers”, “Projects” and “Workobjects”. Next to each chart is a table with the hours and a “Total” row. “(Undefined)” means works where this selection was left empty.
How to view the statistics
- Select the period with a quick button or with dates.
- If you also want to see works your manager has not approved yet, tick “Incl. not approved”.
- Press “Show”.
Tips
- Without the “Incl. not approved” checkbox, only approved works are counted. If the hours seem low, tick this box.
- You can see individual works on the My work history page.
API calls on this page
For integrations and AI assistants: this page uses the following Terake API calls. The full description is in the API reference.
When the page opens:
GET /api/report/stats/{measured_type}/{dimension_type}– Hours of one measure broken down by another; { error: Unknown measured_type } with HTTP 200 for other types.GET /api/report/dailystats– One row per day of the period: { work_date, work_hours }.